本文最后更新于:2025年2月22日 下午
前言
写或者翻译这么多篇 Loki 相关的文章了,发现还没写怎么安装 😓
现在开始介绍如何使用 Helm 安装 Loki.
前提
有 Helm, 并且添加 Grafana 的官方源:
1
2
helm repo add grafana https://grafana.github.io/helm-charts
🐾Warning:
网络受限,需要保证网络通畅.
部署
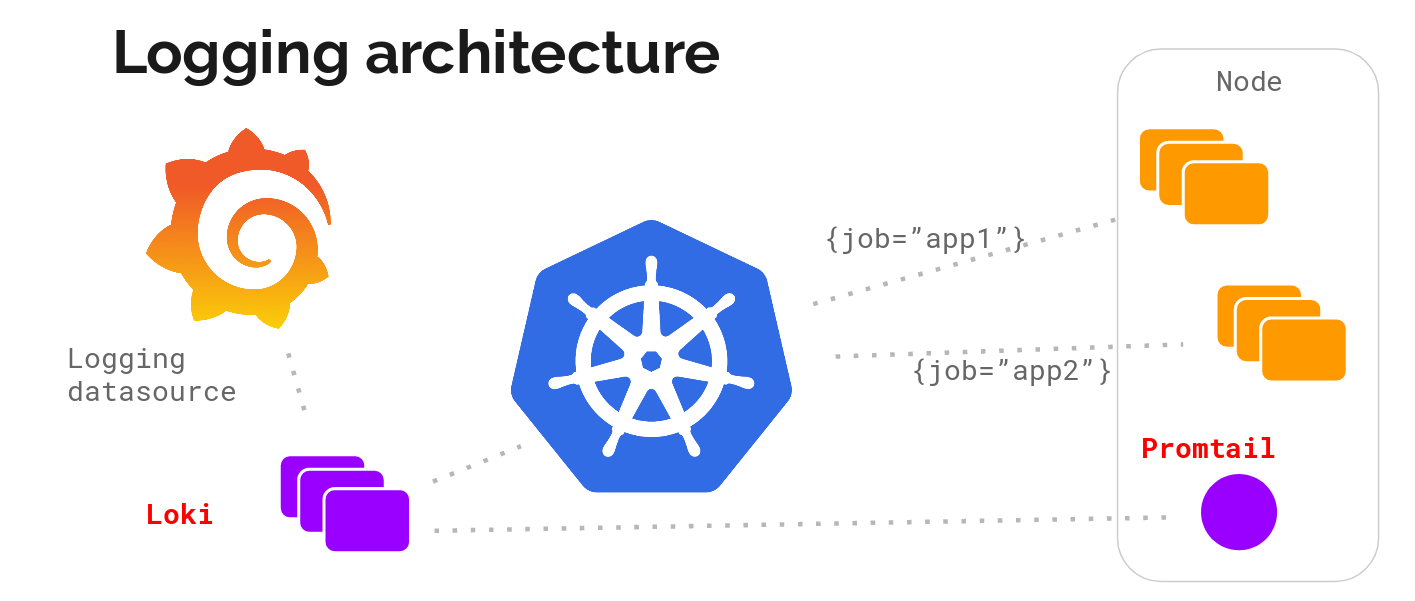
架构
Promtail (收集) + Loki (存储及处理) + Grafana (展示)
Promtail
启用 Prometheus Operator Service Monitor 做监控
增加 external_labels - cluster, 以识别是哪个 K8S 集群;
pipeline_stages 改为 cri, 以对 cri 日志做处理 (因为我的集群用的 Container Runtime 是 CRI, 而 Loki Helm 默认配置是 docker) 增加对 systemd-journal 的日志收集:
1
2
3
4
5
6
7
8
9
10
11
12
13
14
15
16
17
18
19
20
21
22
23
24
25
26
27
28
29
30
31
32
33
promtail: config: snippets: pipelineStages: - cri: {}extraArgs: - -client.external-labels=cluster=ctyun extraScrapeConfigs: - job_name: journal journal: path: /var/log/journal max_age: 12h labels: job: systemd-journal relabel_configs: - source_labels: ['__journal__systemd_unit' ]target_label: 'unit' - source_labels: ['__journal__hostname' ]target_label: 'hostname' extraVolumes: - name: journal hostPath: path: /var/log/journal extraVolumeMounts: - name: journal mountPath: /var/log/journal readOnly: true
Loki
启用持久化存储
启用 Prometheus Operator Service Monitor 做监控
并配置 Loki 相关 Prometheus Rule 做告警
因为个人集群日志量较小,适当调大 ingester 相关配置
Grafana
启用持久化存储
启用 Prometheus Operator Service Monitor 做监控
sidecar 都配置上,方便动态更新 dashboards/datasources/plugins/notifiers;
Helm 安装
通过如下命令安装:
1 helm upgrade --install loki --namespace=loki --create-namespace grafana/loki-stack -f values.yaml
自定义 values.yaml 如下:
1
2
3
4
5
6
7
8
9
10
11
12
13
14
15
16
17
18
19
20
21
22
23
24
25
26
27
28
29
30
31
32
33
34
35
36
37
38
39
40
41
42
43
44
45
46
47
48
49
50
51
52
53
54
55
56
57
58
59
60
61
62
63
64
65
66
67
68
69
70
71
72
73
74
75
76
77
78
79
80
81
82
83
84
85
86
87
88
89
90
91
92
93
94
95
96
97
98
99
100
101
102
103
104
105
106
107
108
109
110
111
112
113
114
115
116
117
118
119
120
121
122
123
124
125
126
127
128
129
130
131
132
133
134
135
136
137
138
139
loki: enabled: true persistence: enabled: true storageClassName: local-path size: 20Gi serviceScheme: https user: admin password: changit! config: ingester: chunk_idle_period: 1h max_chunk_age: 4h compactor: retention_enabled: true serviceMonitor: enabled: true prometheusRule: enabled: true rules: - alert: LokiProcessTooManyRestarts expr: changes(process_start_time_seconds{job=~"loki"}[15m]) > 2 for: 0m labels: severity: warning annotations: summary: Loki process too many restarts (instance {{ $labels.instance }}) description: "A loki process had too many restarts (target {{ $labels.instance }} )\n VALUE = {{ $value }} \n LABELS = {{ $labels }} " - alert: LokiRequestErrors expr: 100 * sum(rate(loki_request_duration_seconds_count{status_code=~"5.."}[1m])) by (namespace, job, route) / sum(rate(loki_request_duration_seconds_count[1m])) by (namespace, job, route) > 10 for: 15m labels: severity: critical annotations: summary: Loki request errors (instance {{ $labels.instance }}) description: "The {{ $labels.job }} and {{ $labels.route }} are experiencing errors\n VALUE = {{ $value }} \n LABELS = {{ $labels }} " - alert: LokiRequestPanic expr: sum(increase(loki_panic_total[10m])) by (namespace, job) > 0 for: 5m labels: severity: critical annotations: summary: Loki request panic (instance {{ $labels.instance }}) description: "The {{ $labels.job }} is experiencing {{ printf \"%.2f\" $value }} % increase of panics\n VALUE = {{ $value }} \n LABELS = {{ $labels }} " - alert: LokiRequestLatency expr: (histogram_quantile(0.99, sum(rate(loki_request_duration_seconds_bucket{route!~"(?i).*tail.*"}[5m])) by (le))) > 1 for: 5m labels: severity: critical annotations: summary: Loki request latency (instance {{ $labels.instance }}) description: "The {{ $labels.job }} {{ $labels.route }} is experiencing {{ printf \"%.2f\" $value }} s 99th percentile latency\n VALUE = {{ $value }} \n LABELS = {{ $labels }} " promtail: enabled: true config: snippets: pipelineStages: - cri: {} extraArgs: - -client.external-labels=cluster=ctyun serviceMonitor: enabled: true extraScrapeConfigs: - job_name: journal journal: path: /var/log/journal max_age: 12h labels: job: systemd-journal relabel_configs: - source_labels: ['__journal__systemd_unit' ]target_label: 'unit' - source_labels: ['__journal__hostname' ]target_label: 'hostname' extraVolumes: - name: journal hostPath: path: /var/log/journal extraVolumeMounts: - name: journal mountPath: /var/log/journal readOnly: true fluent-bit: enabled: false grafana: enabled: true adminUser: caseycui adminPassword: changit! sidecar: image: repository: quay.io/kiwigrid/k8s-sidecar tag: 1.15 .6 sha: '' dashboards: enabled: true SCProvider: true label: grafana_dashboard datasources: enabled: true label: grafana_datasource plugins: enabled: true label: grafana_plugin notifiers: enabled: true label: grafana_notifier image: tag: 8.3 .5 persistence: enabled: true size: 2Gi storageClassName: local-path serviceMonitor: enabled: true imageRenderer: enabled: disable filebeat: enabled: false logstash: enabled: false
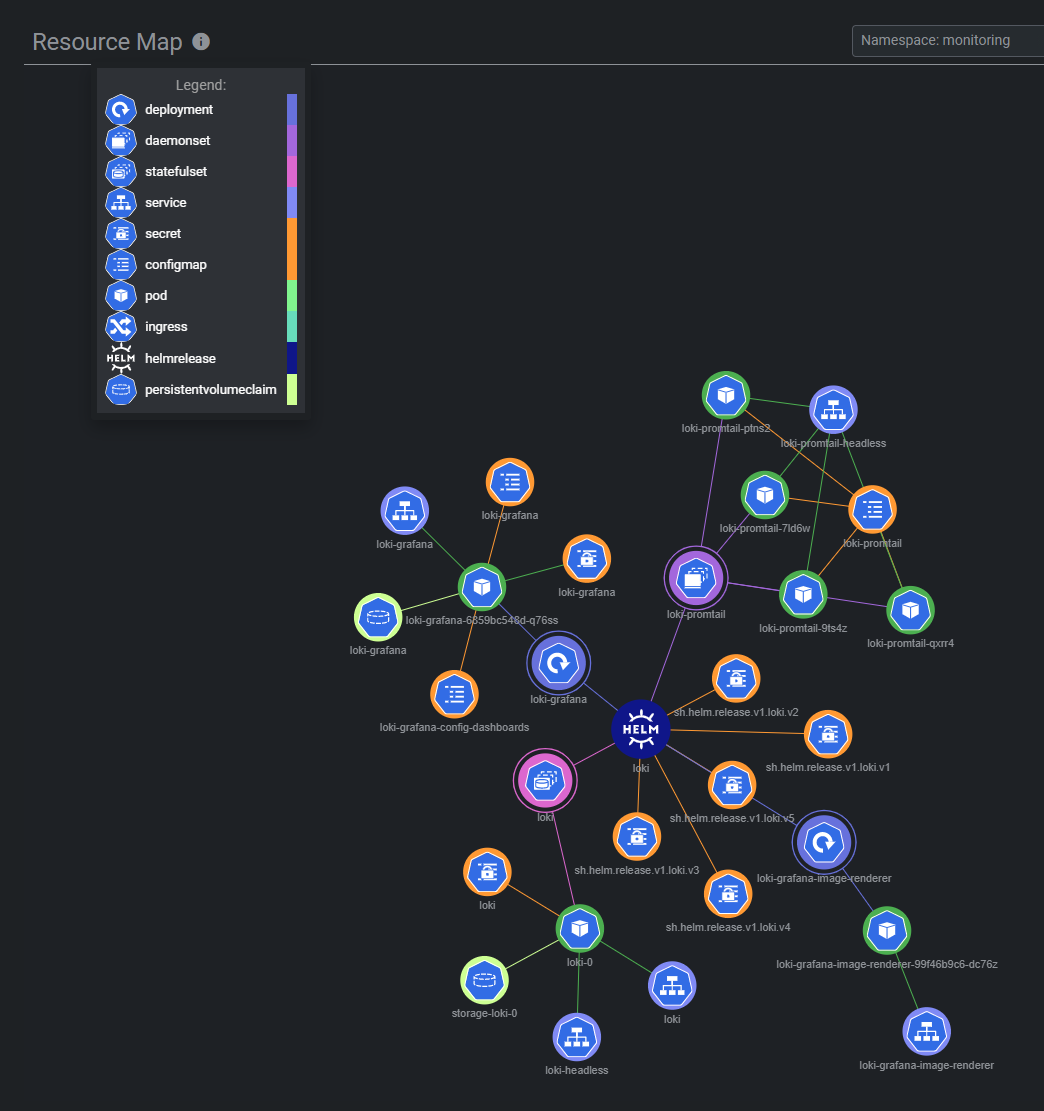
安装后的资源拓扑如下:
Day 2 配置 (按需)
Grafana 增加 Dashboards
在同一个 NS 下,创建如下 ConfigMap: (只要打上 grafana_dashboard 这个 label 就会被 Grafana 的 sidecar 自动导入)
1
2
3
4
5
6
7
8
9
apiVersion: v1 kind: ConfigMap metadata: name: sample-grafana-dashboard labels: grafana_dashboard: "1" data: k8s-dashboard.json: |- ... ]
Grafana 增加 DataSource
在同一个 NS 下,创建如下 ConfigMap: (只要打上 grafana_datasource 这个 label 就会被 Grafana 的 sidecar 自动导入)
1
2
3
4
5
6
7
8
9
10
11
12
13
14
15
apiVersion: v1 kind: ConfigMap metadata: name: loki-loki-stack labels: grafana_datasource: '1' data: loki-stack-datasource.yaml: |- apiVersion: 1 datasources: - name: Loki type: loki access: proxy url: http://loki:3100 version: 1
Traefik 配置 Grafana IngressRoute
因为我是用的 Traefik 2, 通过 CRD IngressRoute 配置 Ingress, 配置如下:
1
2
3
4
5
6
7
8
9
10
11
12
13
14
15
16
17
18
19
20
21
apiVersion: traefik.containo.us/v1alpha1 kind: IngressRoute metadata: name: grafana spec: entryPoints: - web - websecure routes: - kind: Rule match: Host(`grafana.ewhisper.cn`) middlewares: - name: hsts-header namespace: kube-system - name: redirectshttps namespace: kube-system services: - name: loki-grafana namespace: monitoring port: 80 tls: {}
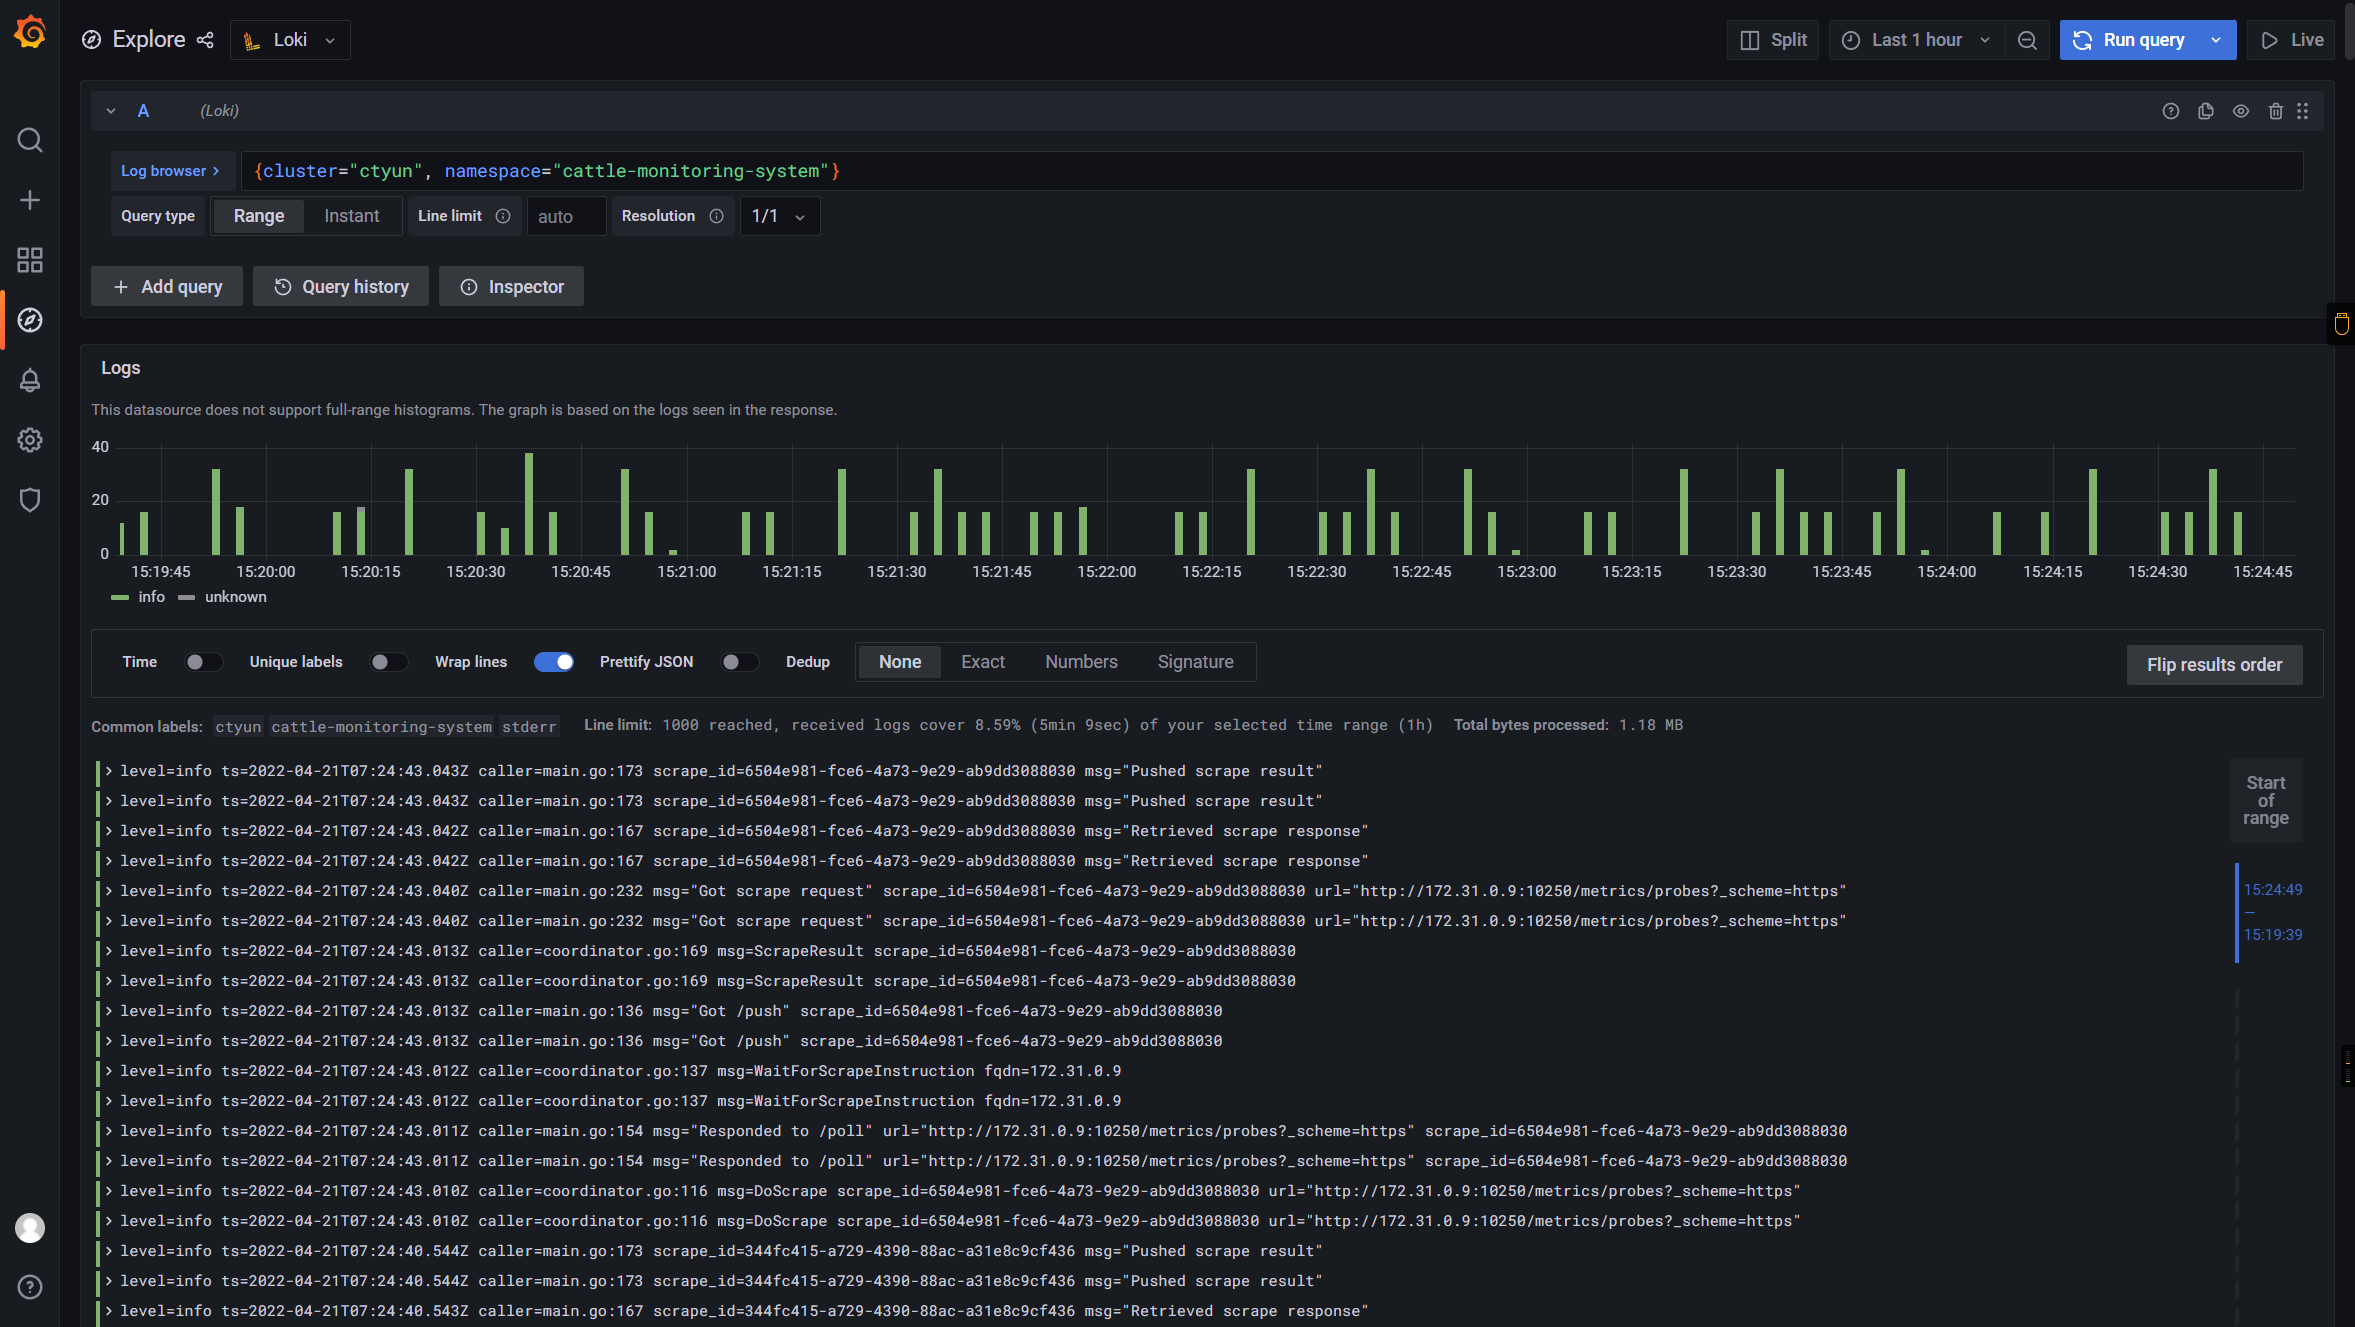
最终效果
如下:
🎉🎉🎉
📚️参考文档
Grafana 系列文章
Grafana 系列文章