本文最后更新于:2025年2月22日 下午
👉️URL: https://grafana.com/docs/tempo/latest/api_docs/pushing-spans-with-http/
📝Description:
有时,使用追踪系统是令人生畏的,因为它似乎需要复杂的应用程序仪器或 span 摄取管道,以便 …
有时,使用追踪系统是令人生畏的,因为你似乎需要复杂的应用程序仪器或 span 摄取管道才能推送 span。本指南旨在展示一种极其基本的技术,即使用 Zipkin 接收器,从 Bash 脚本中用 http/json 推送 span。
启动 Tempo
首先,让我们在配置好 Zipkin 接收器的情况下启动 Tempo。为了做到这一点,要创建一个配置文件,像这样:
1
2
3
4
5
6
7
8
9
10
11
12
| server:
http_listen_port: 3200
distributor:
receivers:
zipkin:
storage:
trace:
backend: local
local:
path: /tmp/tempo/blocks
|
并且运行 Tempo:
1
| docker run -p 9411:9411 -p 3200:3200 -v $(pwd)/config.yaml:/config.yaml grafana/tempo:latest -config.file /config.yaml
|
推送 Spans
现在 Tempo 正在运行,并且在 9411 端口监听 Zipkin spans,让我们用 curl 推送一个 span 到它。
1
2
3
4
5
6
7
8
9
10
11
12
13
14
| curl -X POST http://localhost:9411 -H 'Content-Type: application/json' -d '[{
"id": "1234",
"traceId": "0123456789abcdef",
"timestamp": 1608239395286533,
"duration": 100000,
"name": "span from bash!",
"tags": {
"http.method": "GET",
"http.path": "/api"
},
"localEndpoint": {
"serviceName": "shell script"
}
}]'
|
请注意,timestamp 字段是以微秒为单位的,是通过运行 date +%s%6N 得到的。duration 字段也是以微秒为单位,所以 100000 是 100 毫秒。
接收 Traces
获得追踪的最简单方法是对 Tempo 执行一个简单的 curl 命令。返回的格式是 OTLP。
1
2
3
4
5
6
7
8
9
10
11
12
13
14
15
16
17
18
19
20
21
22
23
24
25
26
27
28
29
30
31
32
33
34
35
36
37
38
39
40
41
42
43
44
45
| curl http://localhost:3200/api/traces/0123456789abcdef | jq
{
"batches": [
{
"resource": {
"attributes": [
{
"key": "service.name",
"value": {
"stringValue": "shell script"
}
}
]
},
"instrumentationLibrarySpans": [
{
"spans": [
{
"traceId": "AAAAAAAAAAABI0VniavN7w==",
"spanId": "AAAAAAAAEjQ=",
"name": "span from bash!",
"startTimeUnixNano": "1608239395286533000",
"endTimeUnixNano": "1608239395386533000",
"attributes": [
{
"key": "http.path",
"value": {
"stringValue": "/api"
}
},
{
"key": "http.method",
"value": {
"stringValue": "GET"
}
}
]
}
]
}
]
}
]
}
|
然而,在 bash 中盯着一个 json blob 不是很有趣。让我们启动 Tempo query ,这样我们就可以直观地看到我们的追踪。Tempo query 是 Jaeger Query 的一个 GRPC Plugin,它可以用来查询 Tempo。
1
| docker run --env BACKEND=localhost:3200 --net host grafana/tempo-query:latest
|
并在你选择的浏览器中打开 http://localhost:16686/trace/0123456789abcdef,以查看:
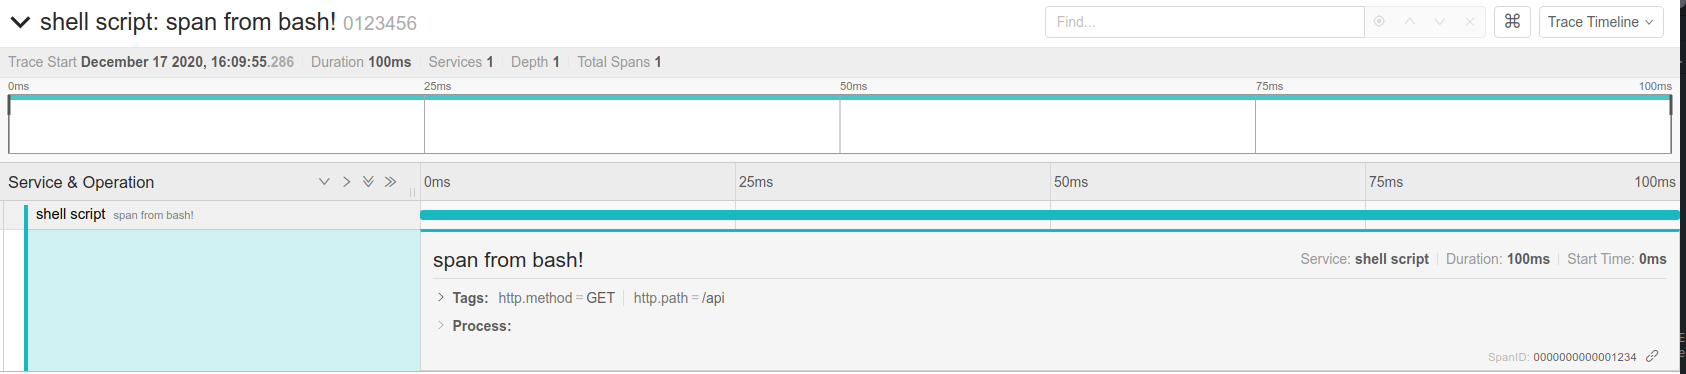
更多 Spans
现在我们已经有了基本的东西,很容易继续建立我们的追踪。通过指定相同的 trace ID 和一个 parent span ID,我们可以开始建立一个追踪。
1
2
3
4
5
6
7
8
9
10
11
| curl -X POST http://localhost:9411 -H 'Content-Type: application/json' -d '[{
"id": "5678",
"traceId": "0123456789abcdef",
"parentId": "1234",
"timestamp": 1608239395316533,
"duration": 100000,
"name": "child span from bash!",
"localEndpoint": {
"serviceName": "shell script"
}
}]'
|
而现在,用户界面显示:
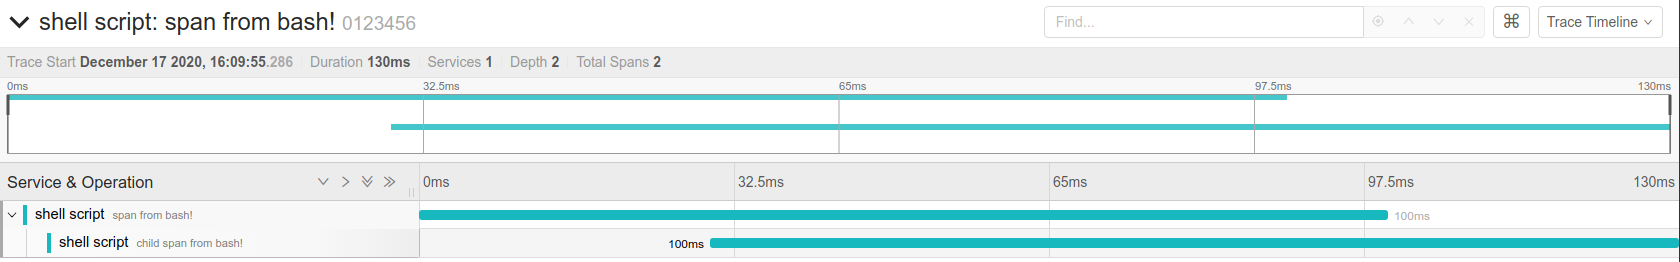
Spans from everything
追踪并不限于具有复杂框架的企业语言。正如你所看到的,从你的 js、python 或 bash 脚本中存储和追踪事件很容易。今天你可以使用 Tempo / 分布式追踪来追踪 CI 管道,长期运行的 bash 进程,python 数据处理流程或任何你能想到的其他东西。
祝你追踪 (tracing) 成功!
Grafana 系列文章
Grafana 系列文章
