Grafana 系列文章(一):基于 Grafana 的全栈可观察性 Demo
本文最后更新于:2025年2月22日 下午
📚️Reference:
这是关于 Grafana 中可观察性的三个支柱的一系列演讲的配套资源库。
它以一个自我封闭的 Docker 沙盒的形式出现,包括在本地机器上运行和实验所提供的服务所需的所有组件。
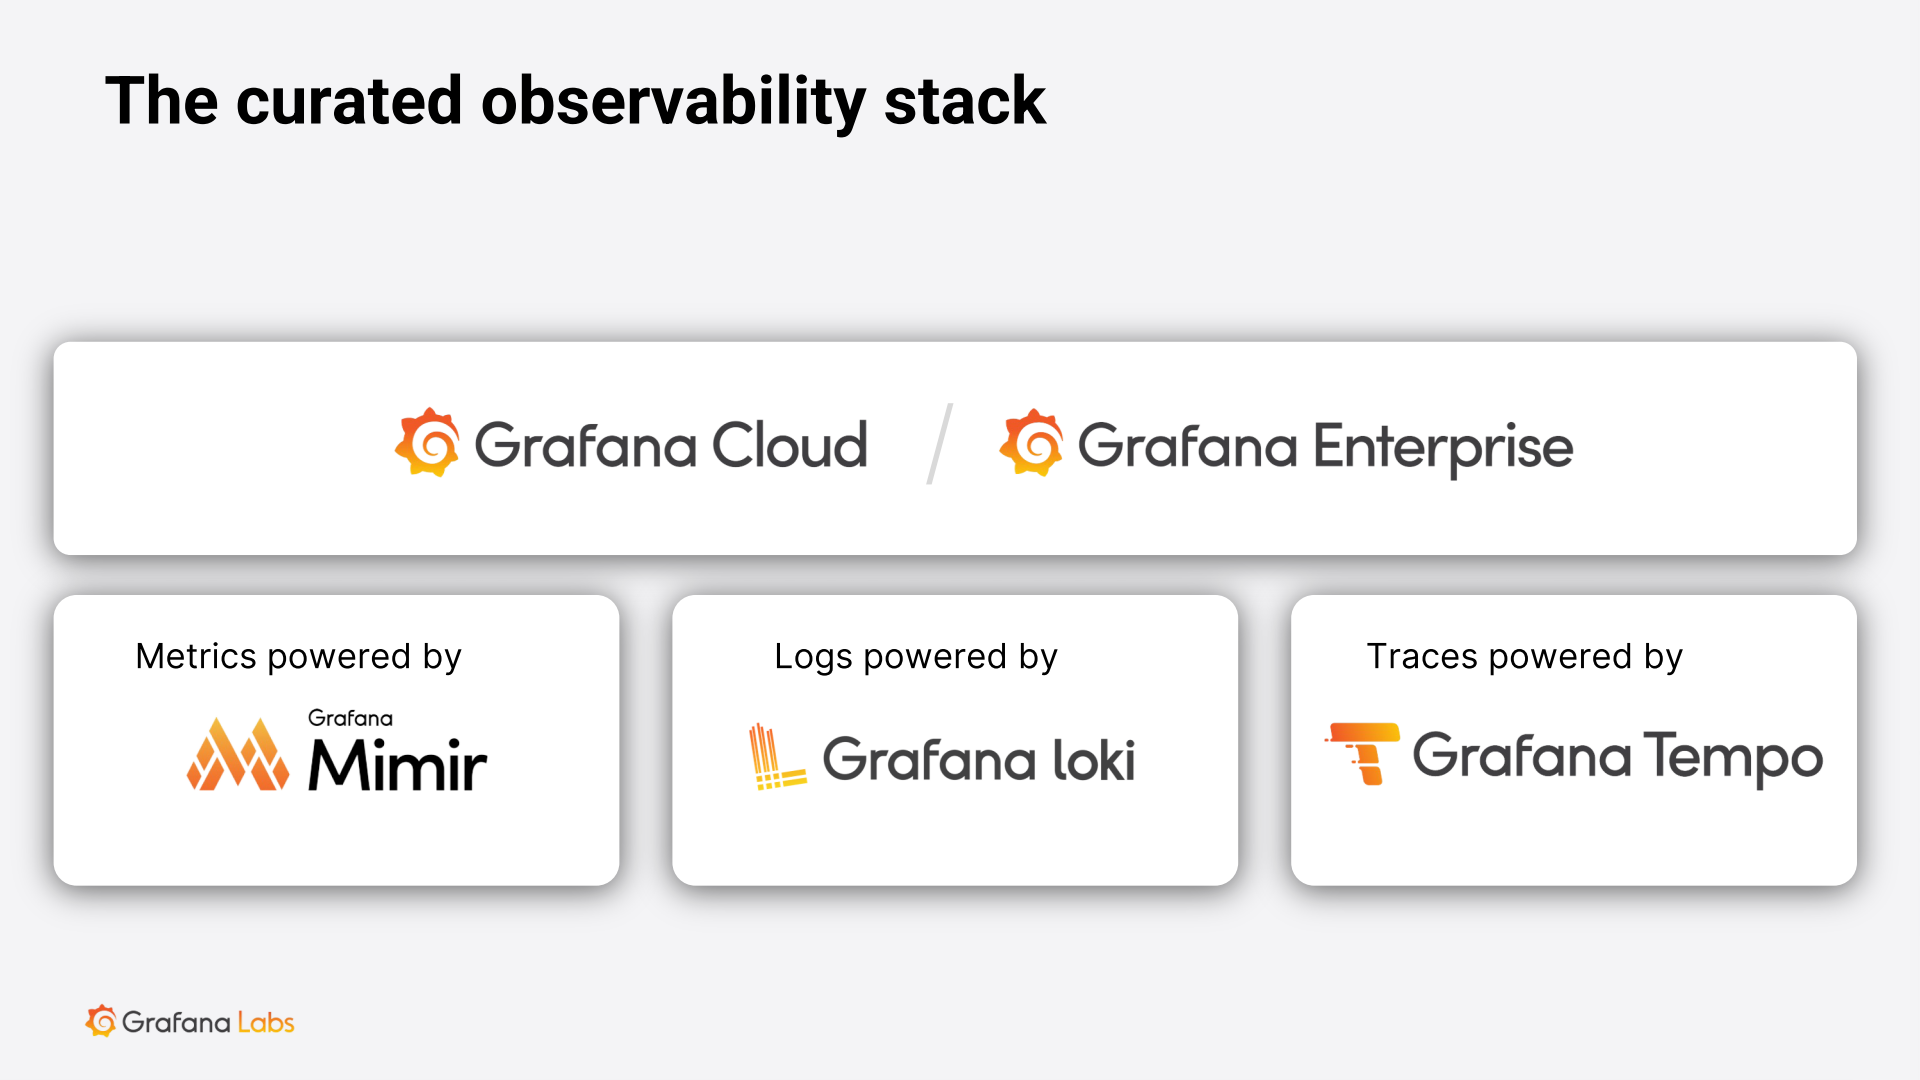
Grafana 全栈可观察性产品
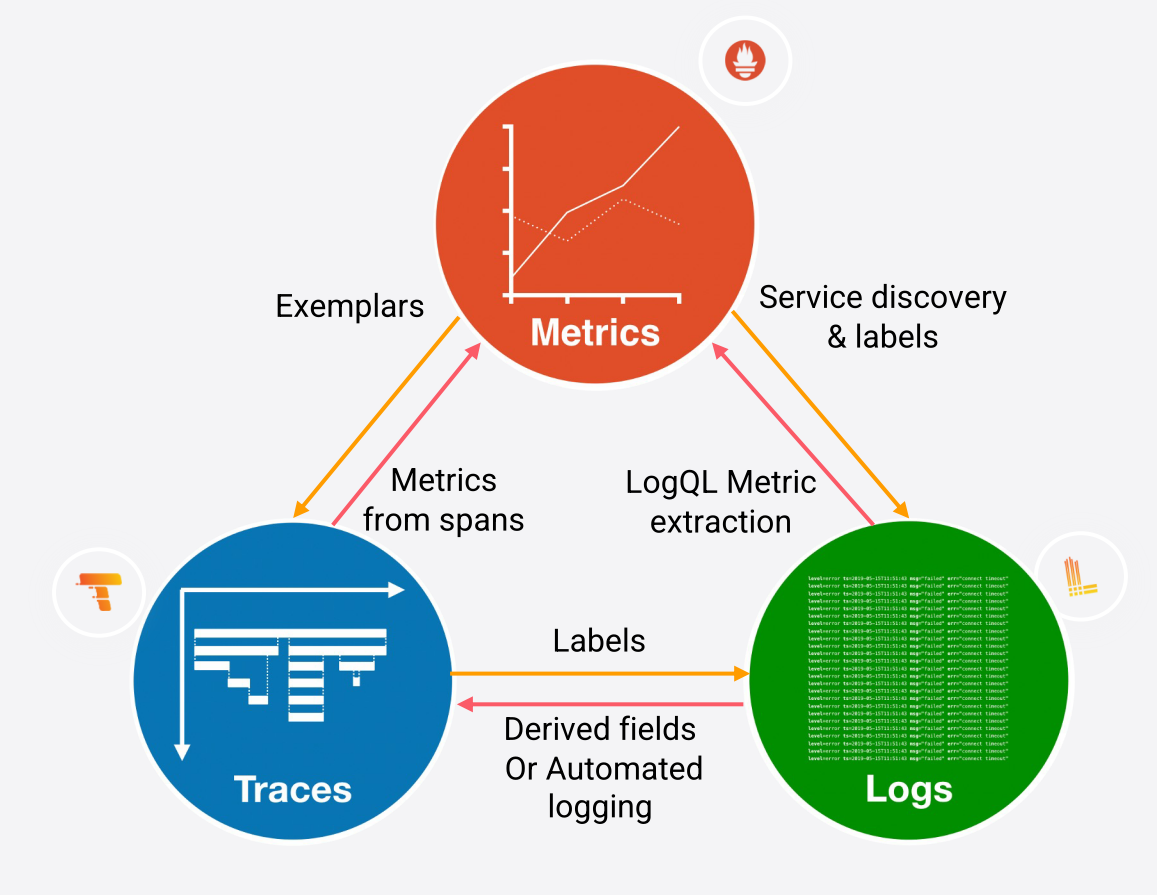
具体的可观察性转换图
前提
概述
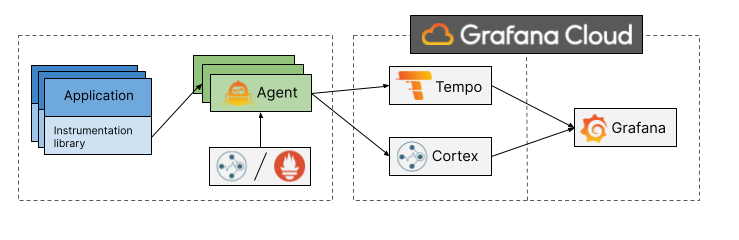
这个系列的演示是基于这个资源库中的应用程序和代码,其中包括:
- Docker Compose 清单,便于设置。
- 三种服务的应用:
- 一个从 REST API 服务器请求数据的服务。
- 一个接收请求的 REST API 服务器,并利用数据库来存储 / 检索这些请求的数据。
- 一个用于存储 / 检索数据的 Postgres 数据库。
- Tempo 实例用于存储 trace 信息。
- Loki 实例,用于存储日志信息。
- 普罗米修斯(Prometheus)实例,用于存储度量 (Metrics) 信息。
- Grafana 实例,用于可视化可观察性信息。
- Grafana Agent 实例,用于接收 trace,并根据这些 trace 产生度量和日志。
- 一个 Node Exporter 实例,用于从本地主机检索资源度量。
运行演示环境
Docker Compose 将下载所需的 Docker 镜像,然后启动演示环境。数据将从微服务应用中发射出来,并存储在 Loki、Tempo 和 Prometheus 中。你可以登录到 Grafana 实例,将这些数据可视化。要执行环境并登录。
-
在你的操作系统中启动一个新的命令行界面并运行:
1
docker-compose up -
登录到本地的 Grafana 实例,网址是:http://localhost:3000/ 注意:这是假设 3000 端口还没有被使用。如果这个端口没有空闲,请编辑
docker-compose.yml文件,并修改这一行1
- "3000:3000"到其他一些空闲的主机端口,例如:
1
- "3123:3000" -
访问 MLT dashboard. (MLT: Metrics/Logging/Tracing)
-
使用 Grafana Explorer 访问数据源。
🐾 注意:
对于中国区用户,可以在需要
build的部分加上 proxy, 如下:
2
3
4
5
6
7
8
9
10
11
12
13
14
15
16
17
18
19
20
21
22
23
24
25mythical-requester:
build:
context: ./source
dockerfile: docker/Dockerfile
args:
HTTP_PROXY: http://192.168.2.9:7890
HTTPS_PROXY: http://192.168.2.9:7890
SERVICE: mythical-beasts-requester
mythical-server:
build:
context: ./source
dockerfile: docker/Dockerfile
args:
HTTP_PROXY: http://192.168.2.9:7890
HTTPS_PROXY: http://192.168.2.9:7890
SERVICE: mythical-beasts-server
prometheus:
build:
context: ./prometheus
args:
HTTP_PROXY: http://192.168.2.9:7890
HTTPS_PROXY: http://192.168.2.9:7890
Grafana
Grafana 是一个可视化工具,允许从各种数据源创建仪表盘。更多信息可以在这里 找到。
Grafana 实例在 docker-compose.yml 清单的 grafana 部分有描述。
1 | |
它:
- 挂载两个资源库目录,为数据提供预置的数据源 (
./grafana/provisioning/datasources.yaml)。 - 预置的仪表盘,用于关联指标、日志和跟踪。(
./grafana/definitions/mlt.yaml) - 为本地登录提供
3000端口。 - 启用两个 Tempo 功能,即跨度搜索 (span search) 和服务图支持 (service graph support)。
不使用自定义配置。
📚️ Reference:
格拉法纳代理 | 格拉法纳实验室 (grafana.com)
- 「它通常用作跟踪管道,从应用程序卸载(offloading )跟踪并将其转发到存储后端。Grafana Agent 跟踪堆栈是使用 OpenTelemetry 构建的。」
- 「Grafana Agent 支持以多种格式接收跟踪:OTLP(OpenTelemetry),Jaeger,Zipkin 和 OpenCensus。」
Prometheus
普罗米修斯是一个后台存储和服务,用于从各种来源刮取(拉取)指标数据。更多信息可以在 这里 找到。此外,Mimir 是 Prometheus 数据的长期保留存储,关于它的信息可以在 这里 找到。
Prometheus 实例在 docker-compose.yml 清单的 prometheus 部分有描述。
1 | |
它是由 prometheus 目录下的一个修改过的 Dockerfile 构建的。这将配置文件复制到新的镜像中,并通过修改启动时使用的命令字符串来启用一些功能(包括 Exemplar 支持 - "--enable-feature=exemplar-storage")。普罗米修斯在 9090 端口暴露其主要接口。
1 | |
配置文件(prometheus/prometheus.yml)定义了几个 scrape 工作,包括。
-
从 Prometheus 实例本身检索指标。(
job_name: 'prometheus') -
从微服务应用中获取指标。(
job_name: 'mythical-server'和job_name: 'mythical-requester') -
来自已安装的 Node Exporter 实例的指标。(
job_name: 'node') -
来自 Grafana Agent 的指标,由传入的跟踪数据得出。(
job_name: 'span-metrics')
📚️References:
Exemplars storage | Prometheus Docs
- 「OpenMetrics 引入了刮取目标的能力,可以将范例 (Exemplars) 添加到特定的度量中。范例是对度量集之外的数据的引用。一个常见的用例是程序跟踪的 id。」
Loki
Loki 是一个用于长期保留日志的后端存储。更多信息可以在 这里 找到。
Loki 实例在 docker-compose.yml 清单的 loki 部分有描述。
1 | |
这个实例只是可用的 latest loki 镜像,并在 3100 端口暴露其接口。
微服务应用程序通过其 REST API 将其日志直接发送到该环境中的 Loki 实例。
Tempo
Tempo 是一个用于长期保留 trace 的后端存储。更多信息可以在 这里 找到。
Tempo 实例在 docker-compose.yml 清单的 tempo 部分有描述。
Tempo 服务导入了一个配置文件(tempo/tempo.yaml),该文件用一些合理的默认值初始化服务,并允许接收各种不同格式的跟踪。
1 | |
1 | |
Grafana Agent
Grafana Agent 是一个本地安装的代理,充当:
- Prometheus 刮削服务。
- Tempo 后端服务接收器 (backend service receiver) 和跟踪跨度处理器 (trace span processor)。
- 一个 Promtail(Loki 日志接收器)实例。
Grafana Agent 具有远程写入功能,允许它将指标、日志和跟踪数据发送到后端存储(如 Mimir、Loki 和 Tempo)。关于 Grafana Agent 的更多信息可以在 这里 找到。
它在这个环境中的主要作用是接收来自微服务应用的跟踪跨度 (trace span),并处理它们以提取指标和日志信息,然后将它们存储到最终的后端存储。
它的配置文件可以在 agent/config.yaml 中找到。
1 | |
1 | |
词汇表
| 英文 | 中文 | 备注 |
|---|---|---|
| Exemplars | 范例 | |
| Derived fields | 衍生字段 | |
| Metrics | 度量 | |
| Logging | 日志 | |
| Tracing | 跟踪 | |
| observability | 可观察性 | |
| span search | 跨度搜索 | Tempo 功能 - 需要 Grafana Agent |
| service graph | 服务图支持 | Tempo 功能 - 需要 Grafana Agent |
| scrape | 刮削 | Prometheus 词汇 |
