Grafana 系列 - 统一展示 - 12-RED Method Dashboard
本文最后更新于:2024年7月25日 下午
系列文章
概述
目前关于监控指标,主流的有 3 个方法 (Method):
- RED : Rate(访问速率), Errors(错误), Duration(响应时长) - 由 @tom_wilkie 引入
- USE : Utilization(利用率), Saturation(饱和度), and Errors(错误) - 由 @brendangregg 引入
- Four Golden Signals:Latency (响应延迟,和 Duration 类似), Traffic (对你的系统有多大的需求,和 Rate 类似), Errors, Saturation. 基本上就是 RED + Saturation.
建议同时使用 RED 和 USE Method, 其中:
- RED Method 关心你的用户以及他们有多快乐
- 而 USE Method 则是关心你的机器以及它们有多快乐
典型 RED Method 监控指标
如果是通过 Prometheus 监控实现,那么典型的指标示例如下:
Rate:
1 | |
Errors:
1 | |
Duration:
1 | |
在这里,Duration 推荐使用 50th/90th/99th percentile, 这些会更精确地反映用户真正关心的问题,同时可以结合 Average Duration 来作为参考.
典型的仪表板示例如下:
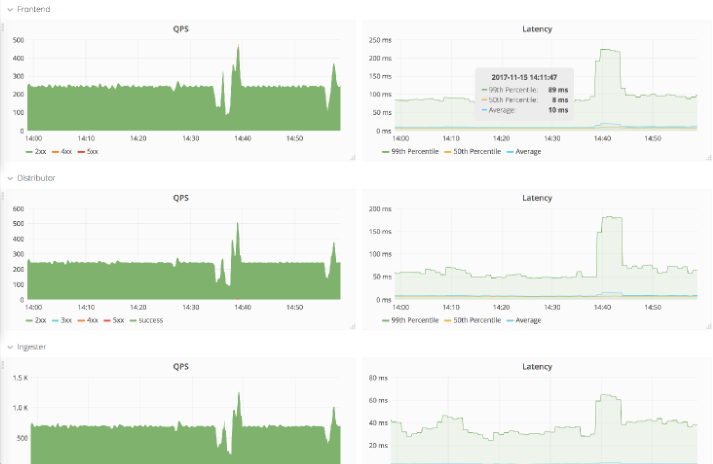
实战 - 基于 ES Access Log 的 RED Method Dashboard
这也是无奈之举,开发并未基于 Prometheus Client 实现 Requests 的相关指标。而是只记录了 Access 日志,并将日志吐到 ES 中,那么我们只能 workaround, 通过 ES 统计日志和关键词、Terms 以实现类似的效果。实现都是可以实现的,但是在实际使用中,也确实发现基于 ES 的监控,性能会差很多。
具体效果如下:
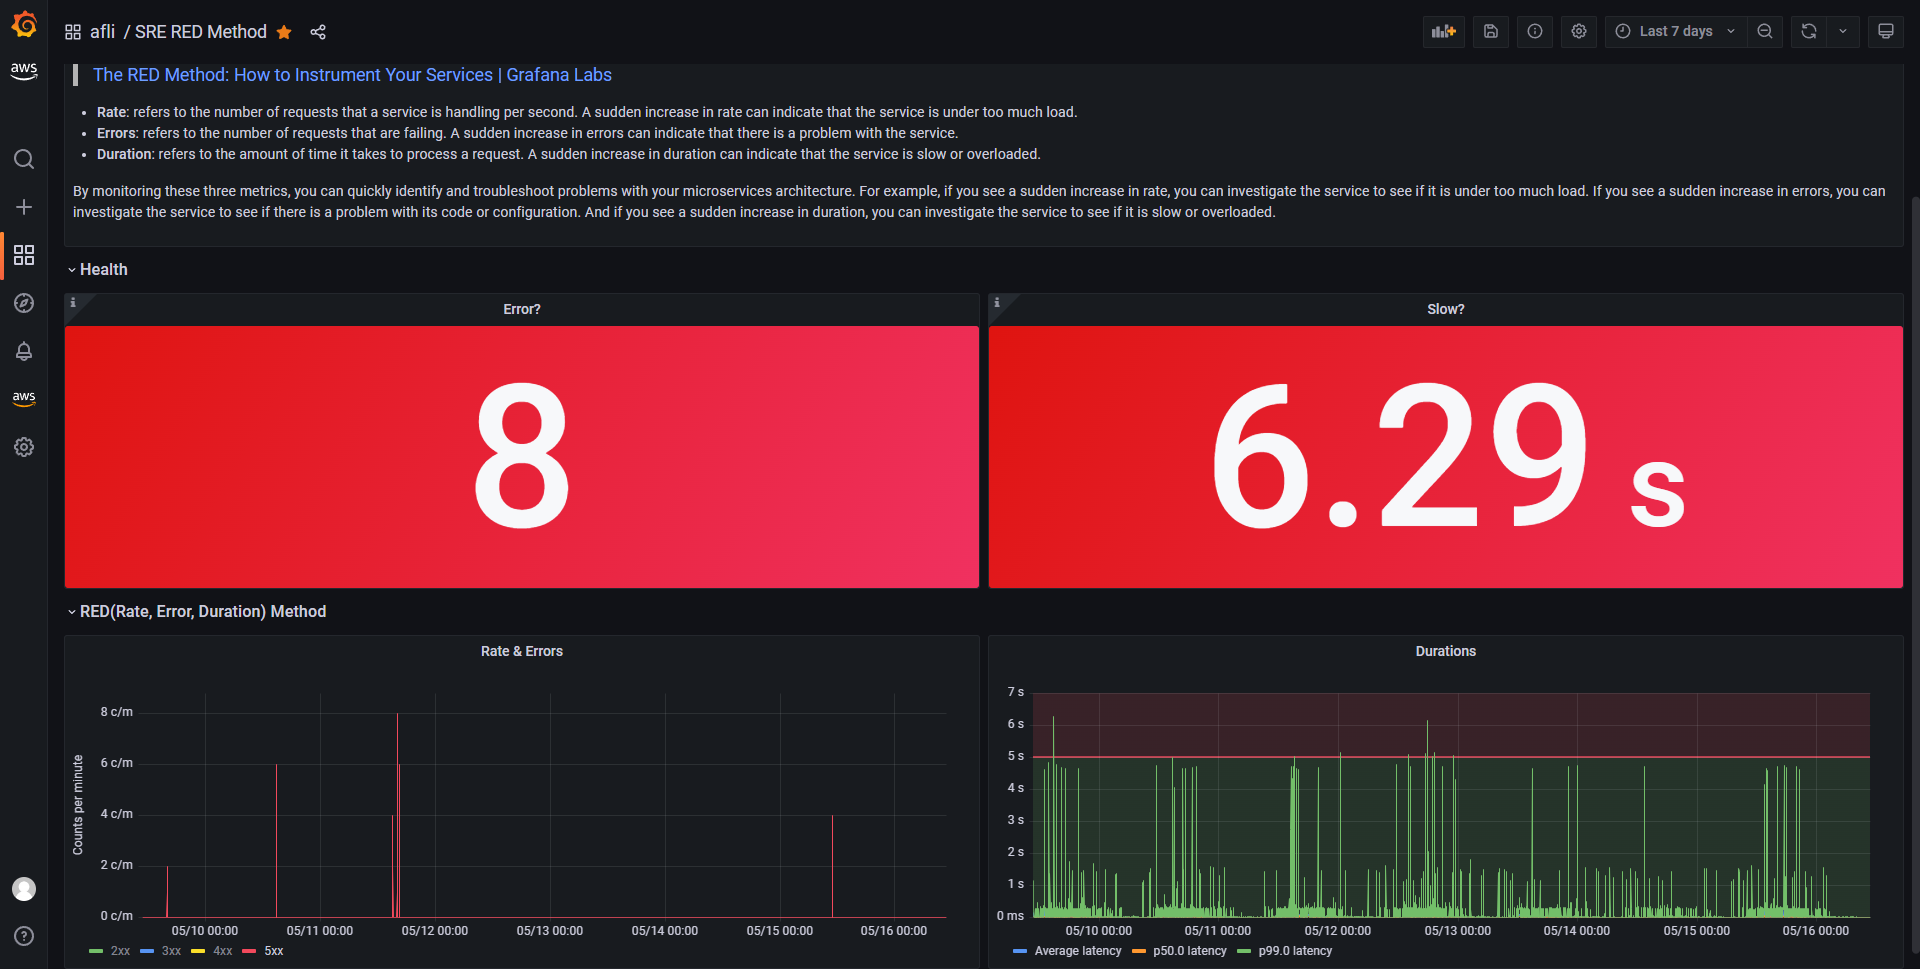
Rate(只能实现每分钟请求数):
以 2xx 举例,Query:
1 | |
如上,排除微服务中场景的监控检查和监控类 url.
下方的 Metric:


Errors:
就是 5xx:
1 | |
Duration:
Query 不在区分 status code:
1 | |
Percentiles 配置如下:

- Metric:
Percentiles - Terms 选择
latency(在我这边的实战中,latency记录的是 Duration) - Values 选择
50,99即计算 50th, 99th percentiles
Average 配置如下:

- Metric:
Average - Terms 选择
latency
最终的效果就是如下:

RED Method 的使用
为了更方便基于 RED Method 的使用,可以进行下钻排查,还基于 Grafana Dashboard Links 做了个简单的关联,方便跳转.
📝Notes:
关于 Grafana Dashboard Links, 应该会在后续文章中详细介绍. 😜😜😜
我们来基于上图,做一下实战分析.
在过去 7 天里,发现最大并发 Error 数有 8 个,最慢 p99 duration 有 6.29s (高于阈值 5s). 我们希望找到对应的 Error 和慢的请求的具体日志.
分析 Errors
对于 Errors, 点击 Rate & Errors Panel 的 5xx legend, 会显示如下:
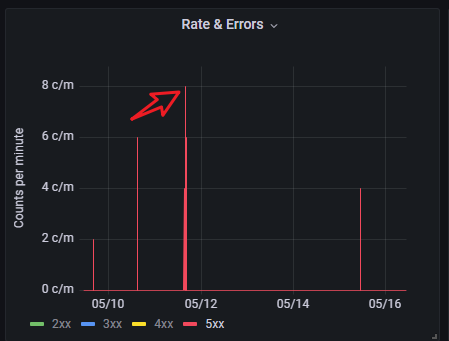
在该 panel 中框选,缩小时间段,如下:
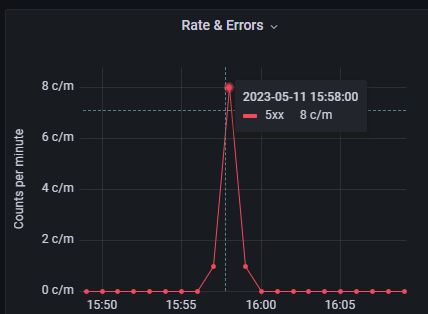
发现发生时间为: 2023-05-11 15:58 左右,点击右上角的 Dashboard Link, 会跳转到 ElasticSearch 快速搜索仪表板 (跳转时会带上同样的时间范围).
因为是分析错误日志,所以可以 status_code varible 中,选择: 500 TO 599, 直接找到相关日志,如下:
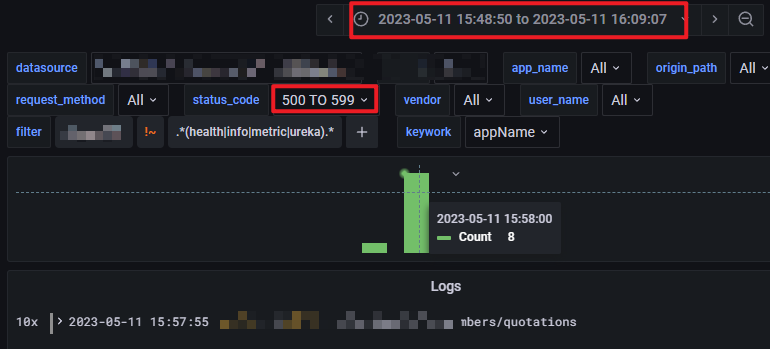
并可以进一步通过 Logs to Trace 定位.
分析慢请求:
同分析错误请求类似套路:
-
在 Durations panel 中缩小时间范围,发现大概时间是: 2023-05-09 14:52 左右
-
通过 Dashboard Links 跳转到 ElasticSearch 快速搜索仪表板
-
添加 ad hoc filter:
latency>5000, 找到具体日志: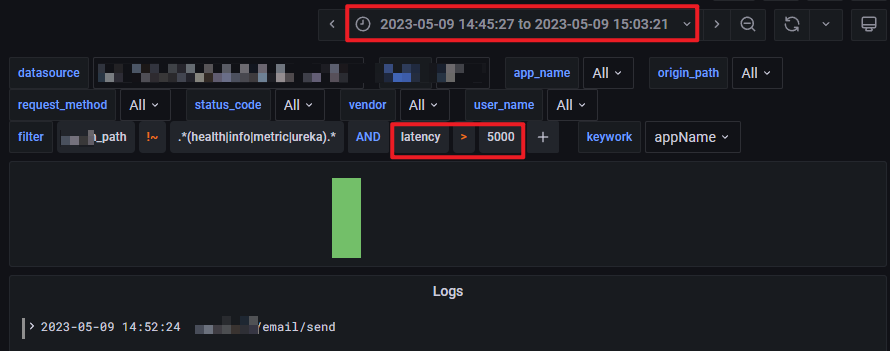
🎉🎉🎉
总结
本文介绍了 3 种常用的监控方法:
- USE Method (面向机器)
- RED Method (面向用户)
- Google SRE Four Golden Signals(RED + Saturation)
并重点基于 RED Method 介绍:
- 基于 Prometheus + Grafana 的指标获取和展示
- 基于 ElasticSearch + Grafana 的指标获取和展示
以及实际基于 RED Method 分析用例.
希望对各位读者有所帮助.😄😄😄
